
What Are Advertising Metrics? A Complete Guide for Publishers
Digital advertising runs on metrics. Every impression served, every click recorded, and every dollar earned is governed by measurable indicators known as advertising metrics.
Many publishers recognize terms like CPM, CPC, or RPM, but still lack a complete mental model of how advertising actually works. They may know individual formulas, yet fail to understand how metrics interact, how to interpret results, and how to turn numbers into revenue decisions.
This guide is designed to solve that problem.
By the end of this article, you will:
- Understand what advertising metrics are
- Know every core metric, its formula, and real-world meaning
- See practical examples for each metric
- Learn how metrics work together as a system
- Avoid common publisher mistakes
- Know how to use tools and calculators to apply these metrics in practice
This is a long-term reference article written for:
- Website publishers
- Bloggers
- Media owners
- Content creators
- AdOps and monetization professionals
What Are Advertising Metrics?
Advertising metrics are quantitative measurements used to track, evaluate, and optimize the performance of digital advertising.
They answer fundamental questions such as:
- How often ads are shown
- How users interact with ads
- How much revenue ads generate
- How efficiently traffic is monetized
In practical terms:
Advertising metrics translate traffic and user behavior into measurable revenue performance.
Without metrics:
- Advertisers cannot price inventory
- Publishers cannot forecast earnings
- Platforms cannot optimize delivery
- Monetization becomes guesswork
Why Advertising Metrics Matter for Publishers
For publishers, advertising metrics are not abstract numbers — they directly impact income.
They determine:
- How much your traffic is worth
- Whether your ad placements are effective
- Why revenue goes up or down
- Which traffic sources are profitable
- How to scale monetization sustainably
A publisher who understands metrics can:
- Increase revenue without increasing traffic
- Identify weak pages or layouts
- Compare monetization strategies objectively
- Make decisions based on data, not assumptions
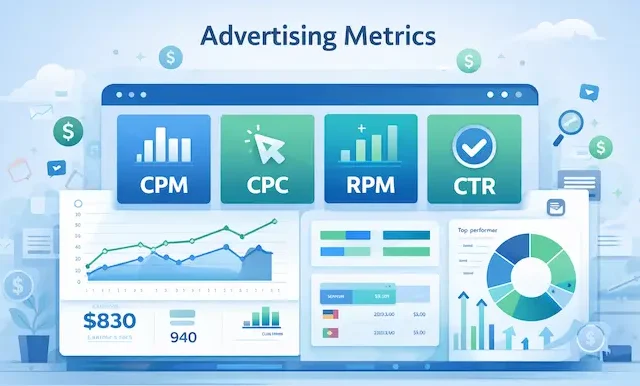
The Four Core Categories of Advertising Metrics
All advertising metrics belong to four core groups.
Understanding this classification is critical because metrics do not operate in isolation.
1. Exposure Metrics (Visibility)
Exposure metrics measure how often ads are displayed.
Impressions
Definition:
The total number of times an ad is shown.
Formula:
No calculation — impressions are counted.
Example:
If an ad appears 10,000 times on your site, you have 10,000 impressions.
What the result means:
High impressions indicate available inventory, not performance. Impressions alone do not guarantee revenue.
Reach
Definition:
The number of unique users who saw an ad.
Example:
10,000 impressions shown to 2,000 unique users = reach of 2,000.
What the result means:
Reach measures audience size, while impressions measure repetition.
Frequency
Definition:
The average number of times a single user sees an ad.
Formula:
Frequency = Impressions ÷ Reach
Example:
10,000 impressions ÷ 2,000 users = Frequency of 5
What the result means:
Each user saw the ad 5 times on average. Excessive frequency may reduce effectiveness.
2. Engagement Metrics (Interaction)
Engagement metrics measure how users interact with ads.
Clicks
Definition:
The number of times users click on an ad.
Clicks indicate user interest but do not measure profitability by themselves.
CTR (Click-Through Rate)
Definition:
The percentage of impressions that result in a click.
Formula:
CTR = (Clicks ÷ Impressions) × 100
Example:
200 clicks ÷ 10,000 impressions × 100 = 2% CTR
What the result means:
A 2% CTR means 2 out of every 100 impressions generate a click.
Higher CTR generally signals better ad relevance.
Engagement Rate
Definition:
Measures user interactions beyond clicks (video engagement, interactions, etc.).
Formula:
Engagement Rate = Engagements ÷ Impressions
What the result means:
Useful for video and rich media ads where interaction matters more than clicks.
View-Through Rate (VTR)
Definition:
The percentage of video ads watched to completion.
Formula:
VTR = Completed Views ÷ Total Views
What the result means:
High VTR indicates strong audience retention and content relevance.
3. Revenue Metrics (Earnings)
Revenue metrics measure how much money advertising generates.
CPM (Cost Per Mille)
Definition:
Cost per 1,000 ad impressions.
Formula:
CPM = (Cost ÷ Impressions) × 1000
Example:
$50 cost ÷ 10,000 impressions × 1000 = $5 CPM
What the result means:
Advertisers pay $5 for every 1,000 impressions.
CPM reflects advertiser demand, not publisher profit.
RPM (Revenue Per Mille)
Definition:
Revenue earned per 1,000 impressions.
RPM is one of the most important metrics for publishers, as explained in Google AdSense’s official documentation.
Formula:
RPM = (Revenue ÷ Impressions) × 1000
Example:
$80 revenue ÷ 10,000 impressions × 1000 = $8 RPM
What the result means:
RPM shows the actual earning power of your traffic.
For publishers, RPM is more important than CPM.
CPC (Cost Per Click)
Definition:
Average cost paid per click.
Formula:
CPC = Cost ÷ Clicks
Example:
$100 ÷ 50 clicks = $2 CPC
What the result means:
Advertisers pay $2 per click. High CPC does not guarantee high revenue without sufficient clicks.
RPC (Revenue Per Click)
Definition:
Revenue generated per click.
Formula:
RPC = Revenue ÷ Clicks
What the result means:
Indicates how valuable each click is from a publisher’s perspective.
CPA (Cost Per Action)
Definition:
Cost required to generate a conversion.
Formula:
CPA = Cost ÷ Conversions
What the result means:
Used primarily in performance-based advertising.
EPC (Earnings Per Click)
Definition:
Common in affiliate marketing; earnings generated per click.
Formula:
EPC = Affiliate Revenue ÷ Clicks
4. Efficiency & Optimization Metrics
These metrics measure how efficiently advertising performs.
ROI (Return on Investment)
Formula:
ROI = ((Revenue − Cost) ÷ Cost) × 100
What the result means:
Shows whether advertising generates profit relative to cost.
ROAS (Return on Ad Spend)
Formula:
ROAS = Revenue ÷ Ad Spend
What the result means:
Indicates revenue generated per dollar spent on ads.
eCPM (Effective CPM)
Formula:
eCPM = (Total Revenue ÷ Total Impressions) × 1000
What the result means:
Normalizes earnings across different ad formats and sources.
Fill Rate
Formula:
Fill Rate = (Filled Requests ÷ Total Requests) × 100
What the result means:
Low fill rate means lost revenue opportunities.
Viewability Rate
Formula:
Viewability = Viewable Impressions ÷ Total Impressions
What the result means:
Ads must be viewable to generate value for advertisers.
How Advertising Metrics Work Together (System Explanation)
Advertising metrics form a connected system, not isolated numbers.
For example:
- A high CPM is meaningless if fill rate is low
- A high CTR does not guarantee high RPM if CPC is weak
- Large traffic volume can still produce low revenue if traffic quality is poor
Real-world relationship example:
If RPM drops:
- Check CTR → Are users engaging?
- Check CPC → Are clicks valuable?
- Check fill rate → Are ads being served?
- Check traffic source → Is demand strong?
Metrics act like diagnostic signals.
Optimizing the wrong metric often leads to false conclusions.
Advertising Metrics vs KPIs (Stronger Distinction)
Metrics measure activity.
KPIs measure outcomes.
Metrics answer:
- What happened?
KPIs answer:
- Is the business succeeding?
For publishers:
- CTR, CPC, CPM = Metrics
- Revenue growth, RPM stability, profit margin = KPIs
KPIs are derived from multiple metrics working together.
Calculating Advertising Metrics in Practice
Advertising metrics are calculated using dedicated metric calculators that allow publishers to:
- Test revenue scenarios
- Forecast earnings
- Compare monetization strategies
On this site, you can use:
Each calculator focuses on a specific metric, while supporting articles in our blog explain:
- What the metric means
- How to improve it
- How it affects monetization decisions
Common Publisher Mistakes with Advertising Metrics
1. Focusing on CPM Instead of RPM
High CPM does not guarantee high earnings. RPM reflects actual revenue.
2. Comparing Metrics Across Unrelated Niches
Comparing a finance site’s RPM to an entertainment blog is misleading due to different advertiser demand.
3. Ignoring Traffic Quality
High traffic volume from low-value regions or low-intent users reduces monetization efficiency.
4. Optimizing One Metric in Isolation
Increasing ad density may boost impressions but reduce engagement and long-term revenue.
5. Misinterpreting Short-Term Fluctuations
Daily or weekly changes do not reflect long-term performance trends.
Final Thoughts
Advertising metrics are not just formulas — they are a decision framework.
Publishers who understand metrics:
- Monetize smarter
- Scale sustainably
- Adapt to platform changes
- Build long-term digital assets
Metrics rarely change.
Understanding them is what creates long-term advantage.
Read Other Articles
- What Is RPM in Google AdSense? Meaning & Explained (2026 Guide)
- What Is CPM? The Complete Guide to Cost Per Mille and How It Impacts Your Earnings
- Understanding RPM: The Key Metric for Publishers and AdSense Earnings
- Understanding Click-Through Rate: An Essential Metric for Publishers and Advertisers